TL;DR: Amazon FBA storage costs include base monthly storage fees, seasonal rate changes, a possible storage utilization surcharge, and aged inventory surcharges beginning at 181 days. A reliable storage fee plan combines Amazon inventory reports with a month-by-month forecast. SellerSprite's Profitability Calculator can then help you test how estimated storage costs affect per-unit profit, margin, and ROI.
Key Takeaways
- Base monthly storage fees are calculated from average daily units, packaged unit volume, product classification, season, and the applicable storage rate.
- Aged inventory surcharges begin at 181 days, not 271 days, and increase sharply once inventory enters the 271-day and older bands.
- SellerSprite does not provide catalog-level inventory aging forecasts. Its Profitability Calculator is best used to include estimated storage costs in a broader per-unit profit model.
Table of Contents
Marketplace note: This guide focuses on the Amazon US marketplace. Fees, thresholds, exemptions, and product classifications can differ by marketplace.
Quick Answer
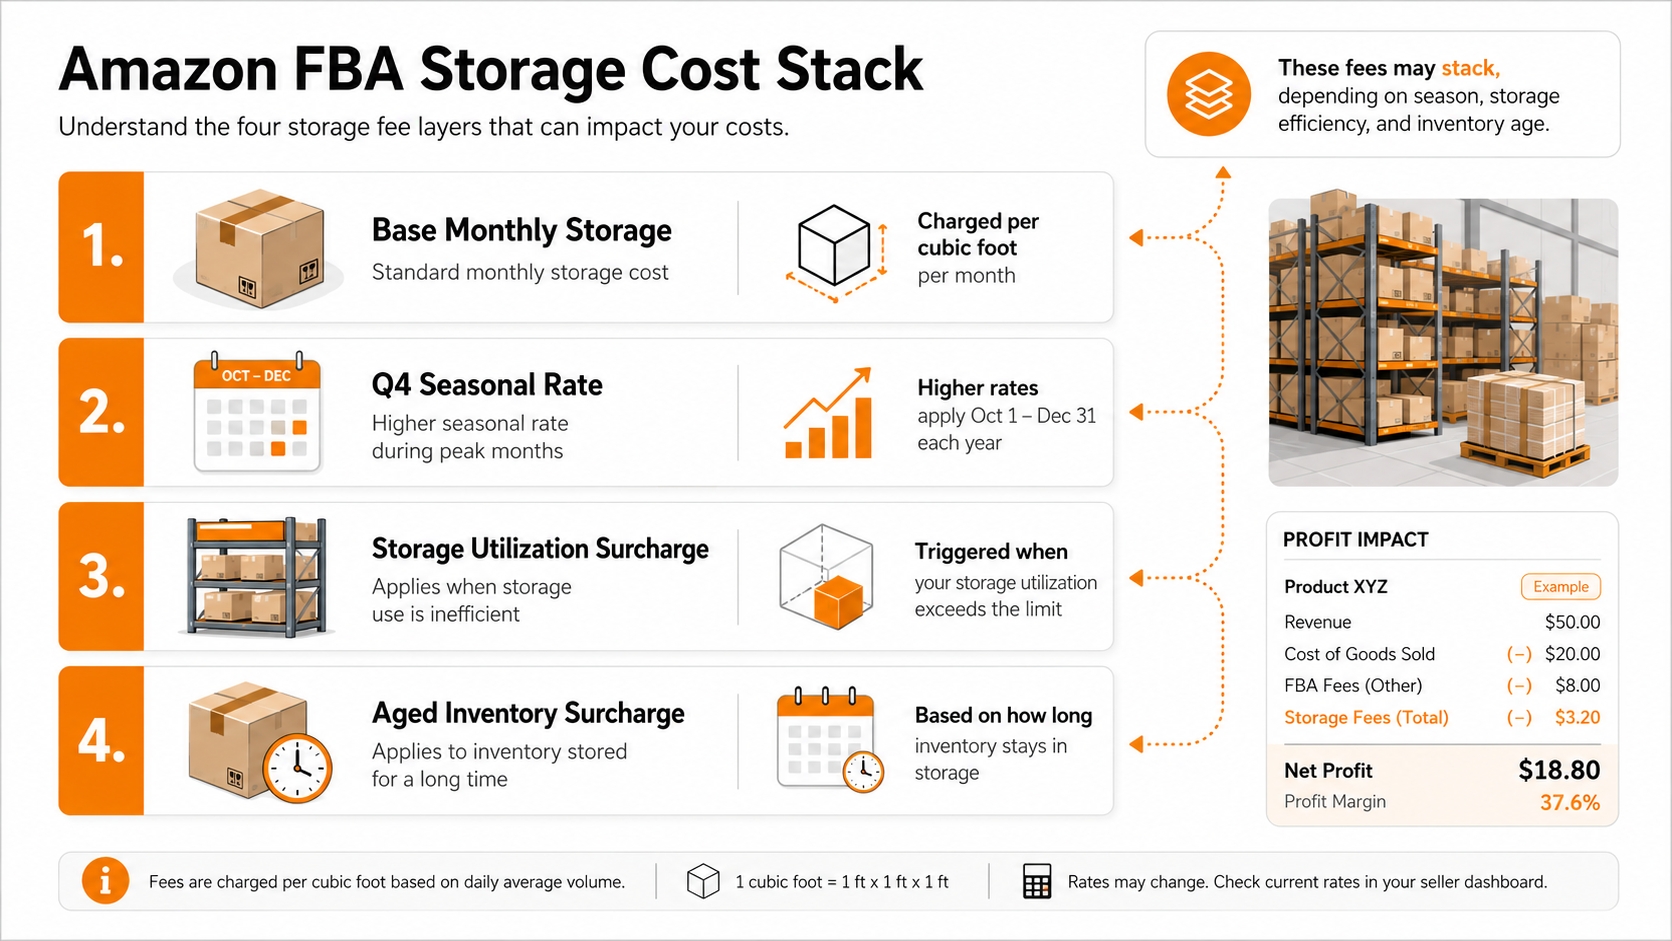
An Amazon storage fee calculator estimates the cost of keeping FBA inventory in Amazon's fulfillment network over time. The basic calculation uses average daily inventory volume and the applicable monthly rate. A complete model must also account for peak-season rates, storage utilization surcharges when applicable, and aged inventory surcharges for units stored for 181 days or longer.
No single input tells the whole story. You need the packaged volume of each unit, average daily units in storage, inventory age buckets, seasonal timing, product classification, and expected sales velocity. For a broader explanation of how Amazon fee and calculator tools work together, see our Amazon calculator guide.
Where SellerSprite fits: SellerSprite does not provide a dedicated ASIN-level storage forecasting tool. Its Profitability Calculator uses product dimensions, weight, storage duration, and other cost inputs to estimate per-unit profitability for Jan-Sep and Oct-Dec scenarios. Separately calculated aged inventory or utilization surcharges can be added as other costs when testing a specific scenario.
Storage cost is a time-based profitability variable
Referral and fulfillment fees are generally connected to a sale. Storage fees behave differently because they can accumulate before a unit sells. This means a product with acceptable launch economics may become less profitable when sales slow, inventory arrives too early, or a seasonal product remains in FBA after its peak demand window.
Storage planning should therefore be completed before a purchase order or FBA replenishment is finalized. The goal is not to eliminate inventory, but to balance stock availability, lead time, shipping efficiency, sales velocity, and the cost of holding excess units.
How Amazon Storage Fees Work
Amazon FBA storage costs are not one flat fee. A seller may pay a base monthly storage fee, an additional storage utilization surcharge, and an aged inventory surcharge on the same inventory. Dangerous goods and certain Amazon programs can follow different rules.
Base monthly inventory storage fee
Amazon calculates base monthly storage fees using the average daily volume occupied by properly packaged inventory. The general formula is:
Monthly Base Storage Fee = Average Daily Units x Unit Volume in Cubic Feet x Applicable Rate
When dimensions are measured in inches, calculate the packaged volume of one unit as follows:
Unit Volume in Cubic Feet = Length x Width x Height / 1,728
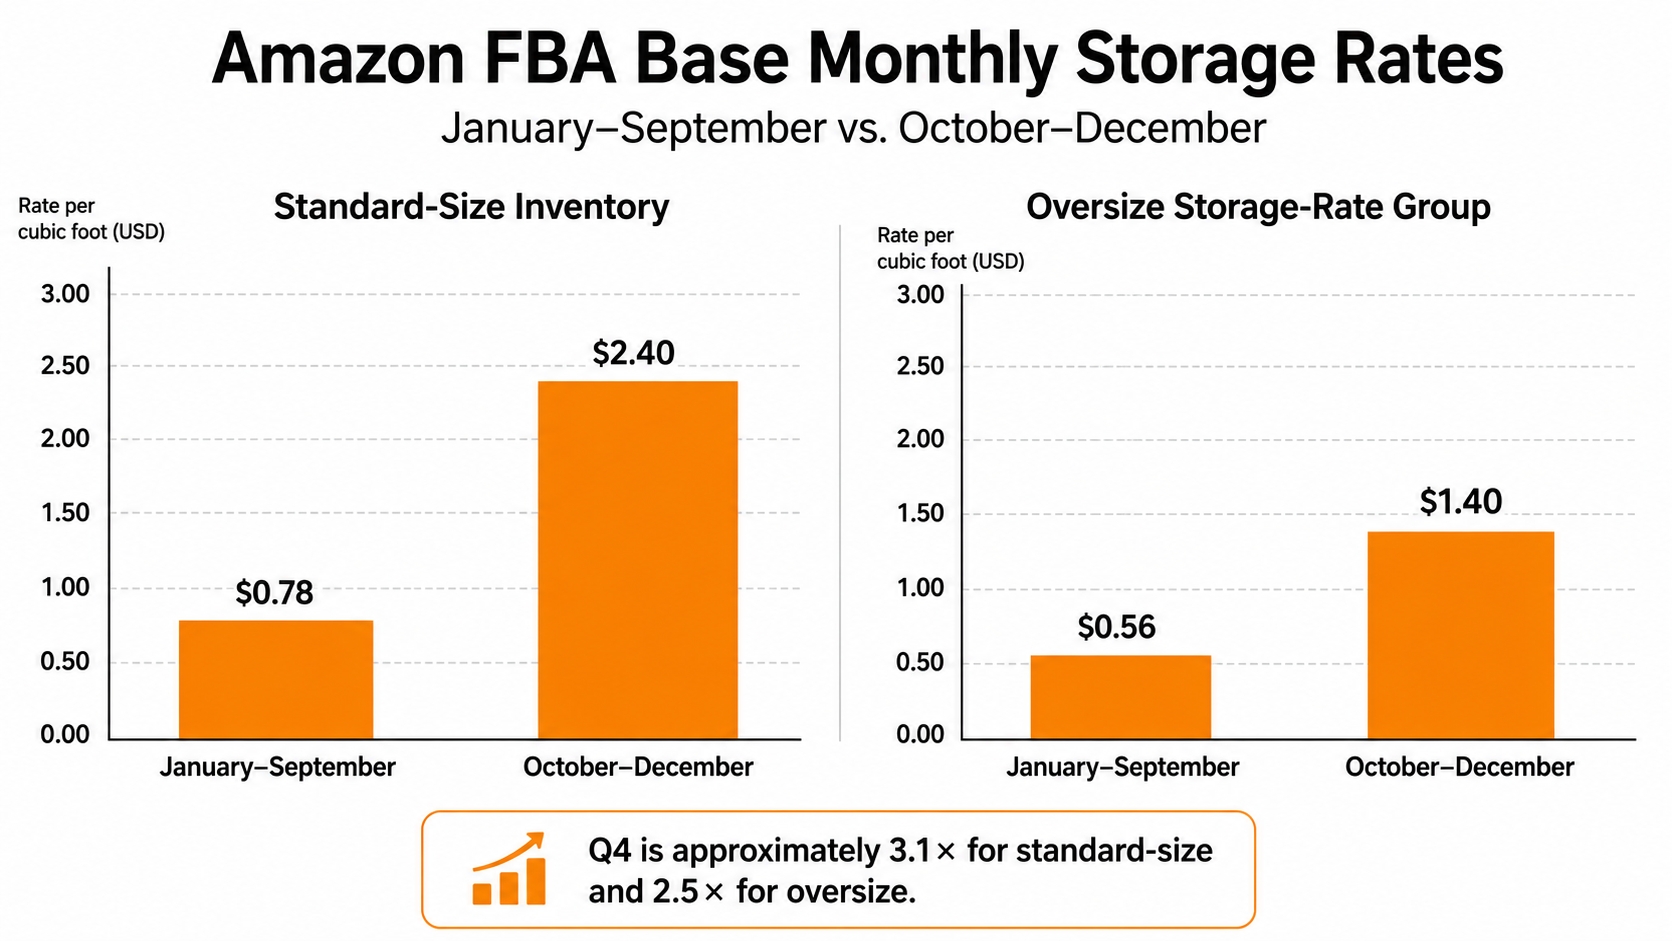
| Storage Period | Standard-Size Non-Dangerous Goods | Oversize Storage-Rate Group |
|---|---|---|
| January-September | $0.78 per cubic foot | $0.56 per cubic foot |
| October-December | $2.40 per cubic foot | $1.40 per cubic foot |
Amazon's monthly storage documentation uses an oversize storage-rate grouping. This should not be confused with the more detailed Small Bulky, Large Bulky, and Extra-Large tiers used in other FBA fee calculations.
Why Q4 assumptions should differ
For standard-size inventory, the Q4 base rate is about 3.1 times the January-September rate. For the oversize storage group, it is 2.5 times the off-peak rate. A shipment that appears affordable in August may become much more expensive if most units remain in FBA through October, November, and December.
Storage utilization surcharge
The storage utilization surcharge is different from the aged inventory surcharge. It is based on the relationship between the inventory volume you store and the inventory volume you ship during the previous 13 weeks.
The surcharge may apply when all of the following are true:
- You have a Professional selling account.
- Your first US FBA shipment was received more than 365 days ago.
- Your average daily inventory volume for the relevant size group is at least 25 cubic feet.
- Your storage utilization ratio is above 22 weeks.
When applicable, the surcharge is added to the base monthly rate and applies to inventory aged more than 30 days.
| Storage Utilization Ratio | Standard-Size Surcharge | Oversize Surcharge |
|---|---|---|
| 22-28 weeks | $0.44/cu ft | $0.23/cu ft |
| 28-36 weeks | $0.76/cu ft | $0.46/cu ft |
| 36-44 weeks | $1.16/cu ft | $0.63/cu ft |
| 44-52 weeks | $1.58/cu ft | $0.76/cu ft |
| 52+ weeks | $1.88/cu ft | $1.26/cu ft |
Storage Utilization Note
A high ratio does not necessarily mean one specific ASIN is slow. Amazon calculates the ratio by product size group, so excess inventory across several products can affect the surcharge applied to eligible inventory in that group.
Aged inventory surcharge
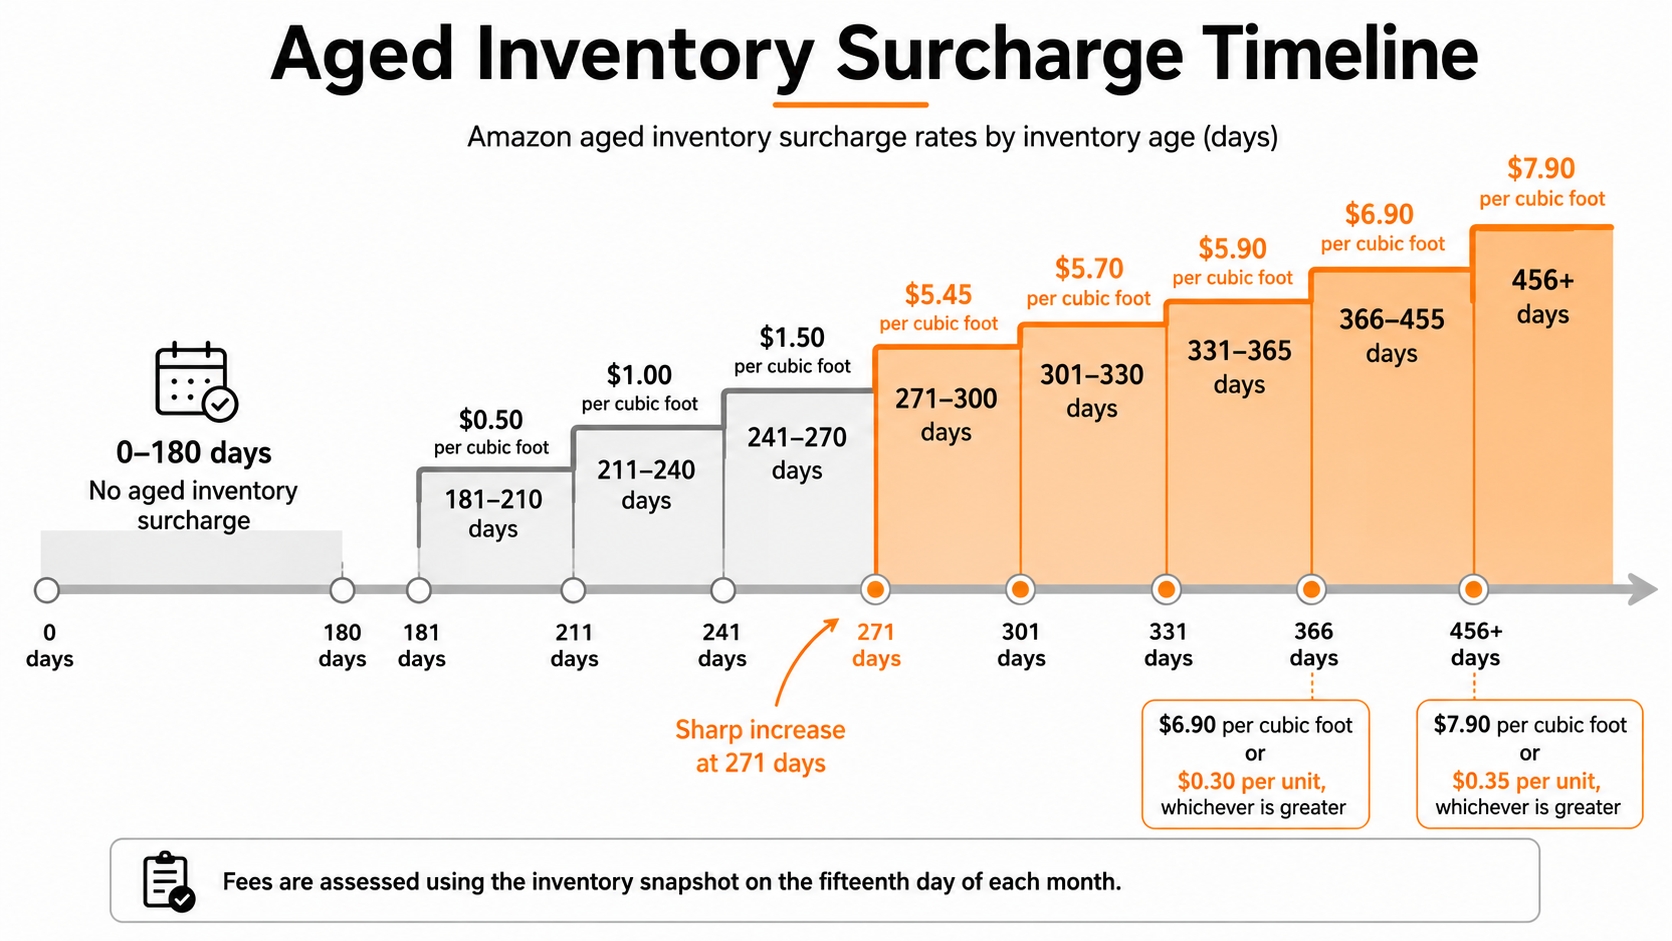
The aged inventory surcharge, previously called the long-term storage fee, applies to inventory stored in Amazon's fulfillment network for 181 days or longer. Amazon assesses the surcharge using an inventory snapshot on the fifteenth day of each month.
Amazon calculates inventory age on a first-in, first-out basis across its fulfillment network. Units sold or removed are deducted from the oldest inventory first for age-calculation purposes.
| Inventory Age | 2026 Aged Inventory Surcharge |
|---|---|
| 181-210 days | $0.50 per cubic foot |
| 211-240 days | $1.00 per cubic foot |
| 241-270 days | $1.50 per cubic foot |
| 271-300 days | $5.45 per cubic foot |
| 301-330 days | $5.70 per cubic foot |
| 331-365 days | $5.90 per cubic foot |
| 366-455 days | $6.90 per cubic foot or $0.30 per unit, whichever is greater |
| 456+ days | $7.90 per cubic foot or $0.35 per unit, whichever is greater |
Certain product categories may be exempt from some 181-365 day surcharge bands. Always verify the current category-specific rules and your projected fee in Seller Central.
Margin Risk Alert
The most significant increase begins when inventory moves from the 241-270 day band at $1.50 per cubic foot to the 271-300 day band at $5.45 per cubic foot. Sellers should start evaluating sell-through, markdown, liquidation, removal, or off-Amazon storage options well before that transition.
Dangerous goods and program exceptions
Dangerous goods use different monthly storage rates because they require specialized handling and storage. Eligible products enrolled in programs such as FBA New Selection may receive temporary storage benefits. Products replenished through Amazon Warehousing and Distribution may also qualify for specific surcharge waivers when program conditions are met.
Treat the standard rates in this guide as a starting point. Confirm the classification, program status, and actual report data for each SKU before finalizing a forecast.
Inputs for Storage Fee Planning
A storage forecast is only as reliable as its inputs. Avoid combining unit count, unit volume, inventory age, and sales velocity into one metric. Each variable serves a different purpose.
Packaged unit volume
Use the dimensions of one fully packaged, sale-ready unit. Do not use the bare product dimensions or master-carton dimensions. Amazon calculates storage volume from the longest side, median side, and shortest side of the packaged unit.
Average daily units
Monthly storage fees are not based only on the units present on the first or last day of the month. Amazon uses average daily inventory. A practical forecast should therefore estimate beginning inventory, incoming replenishment, daily or weekly sales, removals, and ending inventory for each month.
Inventory age buckets
Track how many units are expected to fall into the 181-210, 211-240, 241-270, 271-300, 301-330, 331-365, 366-455, and 456+ day ranges on each monthly assessment date.
Use the FBA Inventory report, FBA Inventory Age and Excess Analytics, and the Aged Inventory Surcharge report rather than estimating every age band from the original purchase-order date alone.
Sales velocity and FBA sell-through rate
Amazon's FBA sell-through rate equals units shipped during the previous 90 days divided by average units on hand during that period. Use it as an inventory-health indicator, not as a direct substitute for a month-by-month demand forecast.
For scenario planning, also track monthly units sold, seasonal demand, promotion periods, lead time, expected stockouts, and planned replenishments.
Storage utilization ratio
Sellers who meet the surcharge eligibility conditions should use the storage utilization ratio displayed in the FBA Dashboard. Because Amazon calculates the ratio by size group, it is not always possible to reproduce it accurately from one ASIN in isolation.
Reorder quantity and arrival month
Reorder quantity affects average inventory, storage exposure, cash flow, and aged inventory risk. The month in which inventory arrives also matters. The same quantity received in September can generate a different three-month storage cost from inventory received in January because October-December rates are higher.
Storage Planning Input Checklist
- Packaged unit dimensions and cubic feet
- Product storage-rate classification
- Dangerous goods status
- Beginning inventory by age band
- Planned inbound quantities and arrival dates
- Expected monthly or weekly unit sales
- Average daily units in storage
- Storage utilization ratio, when applicable
- Planned removals, liquidations, or transfers
How to Build a Storage Cost Scenario
Build the storage forecast month by month rather than applying one rate to the entire order. Separate base storage, utilization surcharges, and aged inventory surcharges so each component can be updated independently.
Step 1: Calculate packaged unit volume
Suppose a standard-size, non-dangerous home organization product occupies 0.05 cubic feet per packaged unit.
Step 2: Forecast average inventory by month
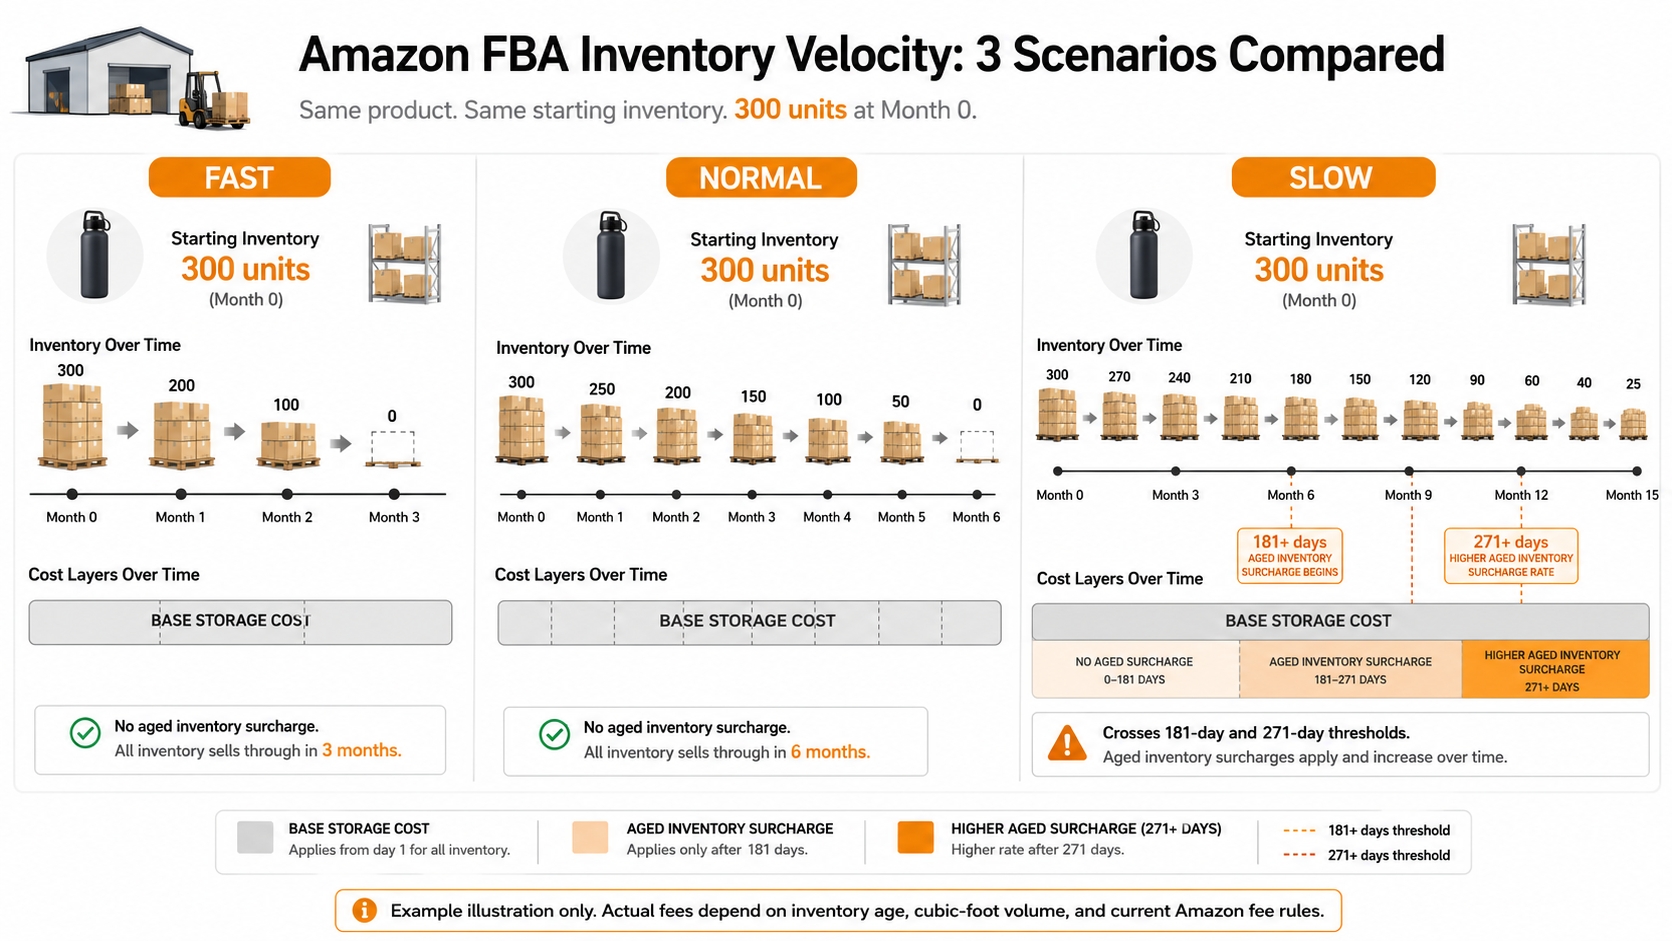
Assume 300 units arrive on January 1 with no additional replenishment. Compare three steady monthly sales scenarios:
- Fast: 100 units sold per month
- Normal: 50 units sold per month
- Slow: 20 units sold per month
Step 3: Apply the correct monthly rate
Use $0.78 per cubic foot for January-September and $2.40 for October-December. If the seller qualifies for a storage utilization surcharge, calculate that amount separately for eligible inventory aged over 30 days.
Step 4: Add aged inventory surcharge exposure
The fast and normal scenarios clear before 181 days. The slow scenario leaves units in every aged inventory band from 181 days through more than 366 days.
| Scenario | Monthly Sales | Approximate Clearance Time | Estimated Base Storage | Estimated Aged Surcharge | Estimated Total Storage Cost |
|---|---|---|---|---|---|
| Fast | 100 units | 3 months | $17.55 | $0.00 | $17.55 |
| Normal | 50 units | 6 months | $35.10 | $0.00 | $35.10 |
| Slow | 20 units | 15 months | $109.62 | $128.83 | $238.45 |
Illustrative example only: The model assumes evenly distributed sales, all 300 units arriving on January 1, no replenishment, no dangerous goods classification, no storage utilization surcharge, and no category exemption. Actual Amazon charges use daily inventory data and monthly inventory snapshots.
Step 5: Convert total storage exposure into a profitability input
A catalog-level storage forecast produces a total SKU cost. To evaluate unit economics, allocate that cost across the units expected to sell from the inventory cohort.
For example, the slow scenario produces an estimated total storage cost of $238.45 across 300 units, or approximately $0.79 per originally received unit. That amount can be included in a conservative per-unit profitability calculation.
How SellerSprite Fits Into the Workflow
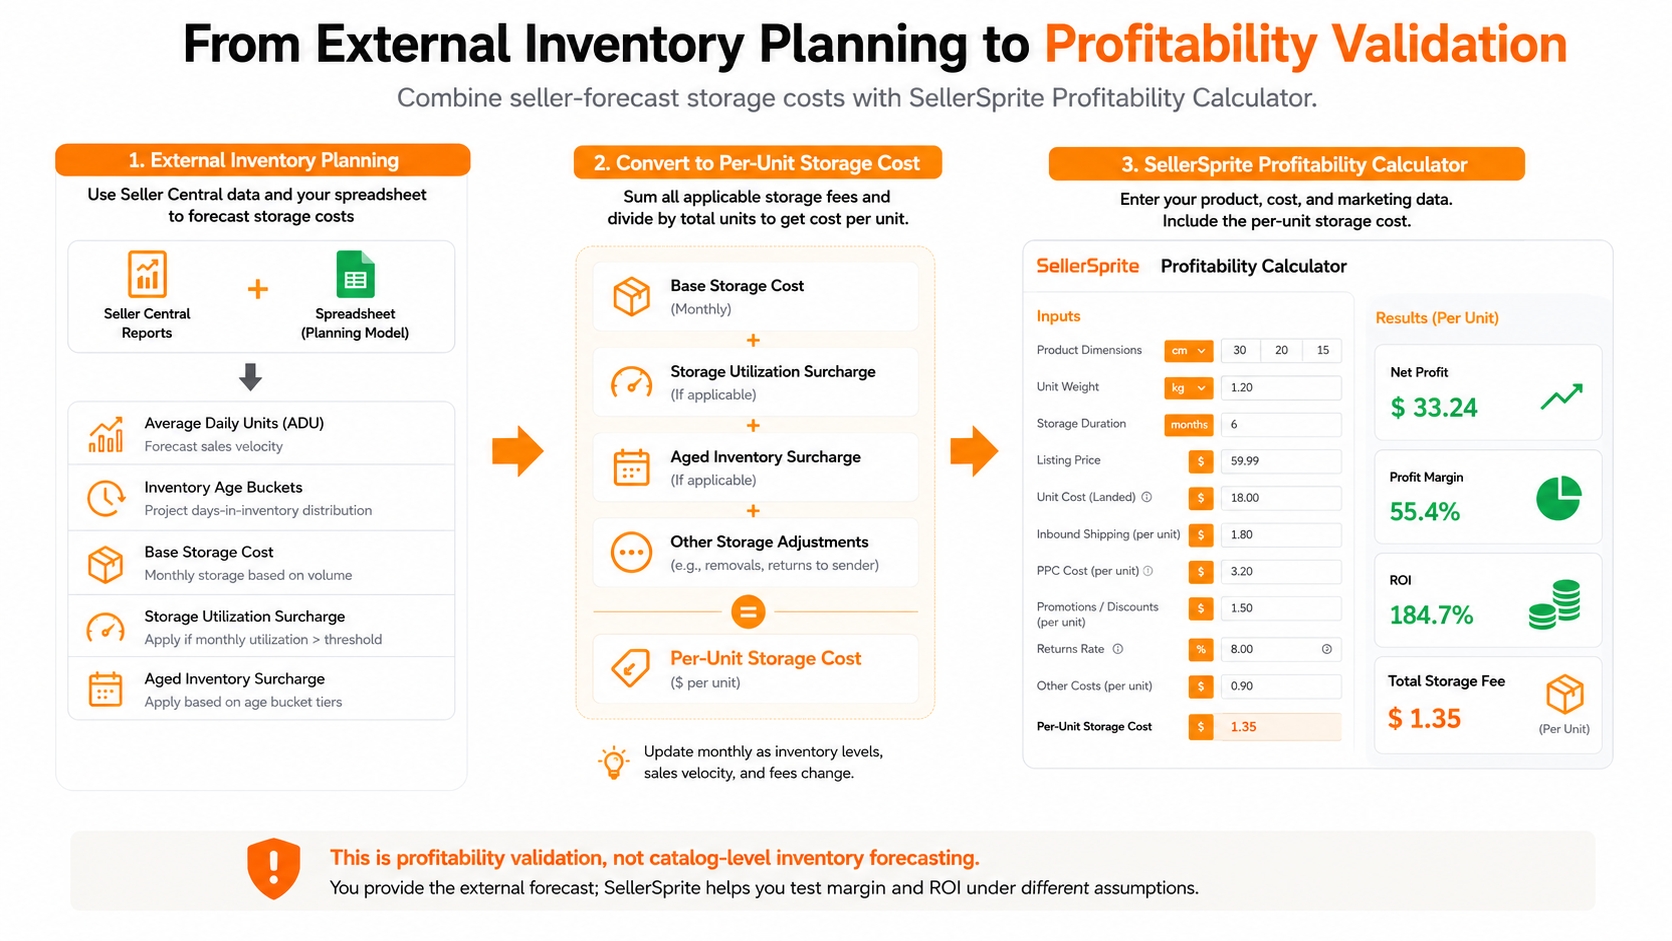
SellerSprite's Profitability Calculator is not a replacement for the FBA Inventory report, Monthly Storage Fees report, Aged Inventory Surcharge report, or a month-by-month inventory forecast. It helps answer the next question: after storage and other Amazon costs are included, is the product still profitable?
Step 1: Build the inventory forecast externally
Use Seller Central reports or a spreadsheet to estimate:
- Average daily units by month
- Monthly base storage cost
- Storage utilization surcharge, when applicable
- Units remaining in each aged inventory band
- Total projected storage cost for the SKU
Step 2: Open the SellerSprite Profitability Calculator
Open the SellerSprite Profitability Calculator, select the FBA calculator and the US marketplace, then enter the packaged product dimensions and weight.
Step 3: Enter storage duration and other product costs
Add the listing price, unit cost, inbound shipping, PPC, promotions, tariffs, returns, category, FBA fee, and expected storage duration. SellerSprite displays separate Jan-Sep and Oct-Dec storage estimates and profitability results.
Important limitation: The seasonal outputs are per-unit profitability scenarios. They are not a catalog-level, month-by-month forecast of average inventory, sell-through, replenishment, or aged inventory.
Step 4: Add separately calculated surcharges
If your scenario includes an aged inventory surcharge or storage utilization surcharge that is not included in the base estimate, convert the projected amount into a per-unit allocation and add it through an appropriate manual cost field, such as Other Costs.
Step 5: Review the profitability result
Review Net Profit, Profit Margin, ROI, Total Storage Fee, and the full cost breakdown. Compare at least three assumptions:
- Expected case: Forecast sales and normal storage duration
- Downside case: Slower sales, Q4 exposure, and aged inventory
- Action case: Lower price, higher PPC, removal, or reduced inbound quantity
How to Reduce Storage Fee Risk
Reducing storage risk does not mean holding the smallest possible inventory at all times. The goal is to maintain enough stock to support demand while avoiding inventory that is unlikely to sell within its planned holding period.
Use staged FBA replenishment
You do not always need to send an entire purchase order into FBA at once. Depending on economics and lead time, part of the inventory can remain with a supplier, 3PL, prep center, or bulk storage provider and replenish FBA in smaller stages.
Compare the additional handling and transportation cost with the storage, utilization, and aged inventory costs avoided. The lower-storage option is not automatically the lowest-total-cost option.
Forecast with multiple demand cases
Use historical sales, seasonality, keyword demand, conversion trends, promotions, stockouts, and competitor activity to create conservative, expected, and upside forecasts. Apply the forecast to actual supplier lead time and inbound receiving time rather than choosing one universal days-of-supply target.
Review age bands before the monthly snapshot
Review inventory approaching 181, 241, 271, 331, 366, and 456 days. The largest operational priority is usually inventory likely to enter a substantially more expensive band before the next monthly assessment.
Potential actions include improving the listing, adjusting price, increasing advertising, running eligible promotions, using Amazon Outlet, liquidating inventory, submitting a removal order, or moving future stock to another storage solution.
Compare markdown cost with holding cost
Do not assume that a discount is automatically cheaper than storage. Compare:
- Profit lost from the lower selling price
- Additional PPC or promotion cost
- Base storage that would otherwise accumulate
- Potential aged inventory surcharge
- Removal, disposal, liquidation, or return freight cost
- Opportunity cost of tied-up cash and FBA capacity
The best action is the one that produces the strongest expected recovery after all relevant costs, not simply the option with the lowest visible fee.
Monitor official inventory reports
Use the Monthly Storage Fees report to review the dimensions, volume, size classification, average units, and fees Amazon used. Use the FBA Inventory report and age analytics to identify excess and aging units. Use the Aged Inventory Surcharge report to reconcile actual surcharge charges.
FAQ
Does SellerSprite have a dedicated Amazon Storage Fee Calculator?
SellerSprite provides a Profitability Calculator rather than a dedicated inventory forecasting tool. It can estimate base storage costs using product dimensions and storage duration, display separate Jan-Sep and Oct-Dec profitability scenarios, and include manually entered costs. It does not automatically forecast ASIN-level sell-through, replenishment, inventory age bands, or aged inventory surcharges.
When does Amazon's aged inventory surcharge begin?
The aged inventory surcharge begins when eligible inventory reaches 181 days in Amazon's fulfillment network. Amazon assesses the fee using an inventory snapshot on the 15th day of each month. The surcharge is added to the regular monthly inventory storage fee.
What is the difference between monthly storage and aged inventory fees?
Base monthly storage applies to inventory occupying space in FBA and is based on average daily volume. The aged inventory surcharge applies only to eligible inventory stored for 181 days or longer. The two charges can apply to the same inventory during the same month.
What is the storage utilization surcharge?
It is an additional monthly storage charge that may apply to eligible Professional sellers whose stored inventory volume is high relative to shipped volume. It is calculated by product size group and applies only when Amazon's account, volume, inventory-age, and utilization-ratio conditions are met.
Why are Amazon storage fees higher in Q4?
Amazon applies higher base storage rates from October through December when fulfillment-center capacity is under greater seasonal demand. For non-dangerous standard-size inventory, the base rate increases from $0.78 to $2.40 per cubic foot.
How is the FBA sell-through rate calculated?
Amazon calculates the FBA sell-through rate as units shipped during the past 90 days divided by the average number of units on hand in its fulfillment centers during that period. It is an inventory-health metric rather than a direct monthly storage fee formula.
Should seasonal products use different storage assumptions?
Yes. Seasonal products need a month-by-month model that includes the higher October-December base rates, the expected peak selling window, remaining post-season inventory, and the possibility that unsold units will eventually enter aged inventory bands.
How can sellers reduce Amazon storage fee risk?
Sellers can improve demand forecasting, use staged FBA replenishment, monitor inventory age bands, review storage utilization, adjust pricing or advertising when appropriate, and compare liquidation or removal costs with the cost of continuing to hold inventory.
Next Steps
- Download your FBA Inventory and Monthly Storage Fees reports and confirm packaged volume, average inventory, size classification, and age bands.
- Build a month-by-month expected, downside, and seasonal inventory forecast.
- Calculate base storage, storage utilization, and aged inventory costs separately.
- Convert the projected SKU-level storage cost into a per-unit assumption.
- Enter that assumption into the SellerSprite Profitability Calculator and review the resulting Net Profit, Profit Margin, and ROI.
References
- Amazon Monthly Inventory Storage Fees View
- Amazon Aged Inventory Surcharge View
- Amazon 2026 US Referral and FBA Fee Changes View
- Amazon Inventory Performance View
- Amazon Monthly Storage Fees Report View
- Amazon FBA Inventory Report View
- SellerSprite Amazon Calculator Guide View
By SellerSprite Success Team
The SellerSprite Success Team combines Amazon marketplace experience with data-analysis expertise to help sellers evaluate product demand, operating costs, inventory risk, and profitability using practical workflows and marketplace data.
Last updated: 2026-07-29